After Bitcoin crashed below the fabled $40,000 ($55,989 AUD) mark late last month on Jan. 21, crypto investors everywhere began to watch the charts with increasingly pained expressions. A few days later, Bitcoin had continued its collapse to reach a new yearly low of $33,495 ($46,883 AUD). Since then, Bitcoin has rallied just over 20% and is currently trading for $44,090 ($61,812 AUD).
This recent recovery above $40,000 has been met with a mixture of relief and apprehension by investors. While crypto investors are undeniably relieved that a short-term reversal may be underway, Bitcoin still has a long way to go before officially re-entering “bull territory” and many experts fear that it may be too soon to celebrate.
As analyst Justin Bennet puts it:
“BTC needs to close consistently above the $42,000 area to confirm a bullish breakout and expose $45,000-$46,000”
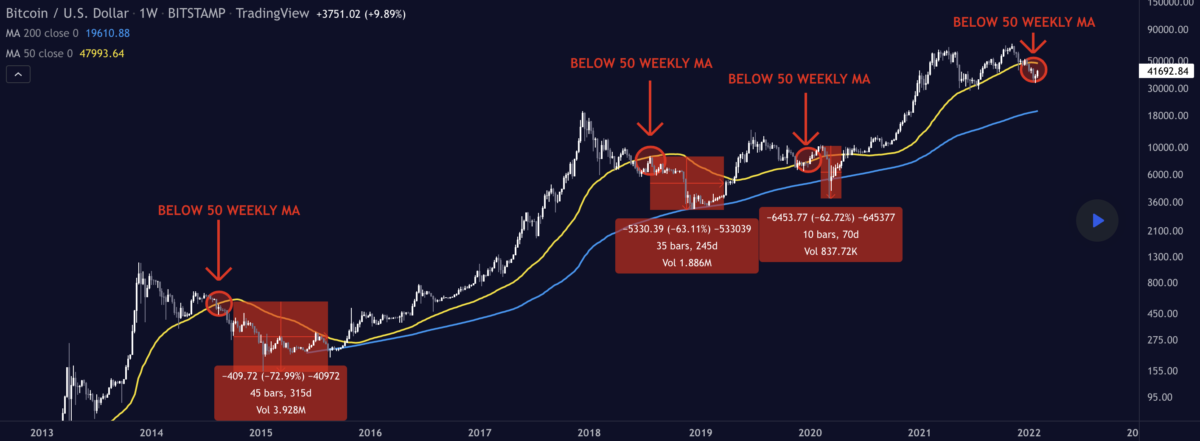
Bitcoin Falls Below 50-Day Moving Average
All assets, whether that be gold, oil, Facebook shares or Bitcoin, all have their own unique set of historical patterns that experienced investors can read to better predict price action. When it comes to Bitcoin one of the favored technical indicators is its array of Moving Averages (MA), in this case specifically, the 50-day moving average.
For the first time in just over 2 years, Bitcoin has traded below its 50-day moving average. Bitcoin has only ever traded below its 50-day moving average three times in the past (2014, 2018 & 2019), each of which was followed by a significant and prolonged tumble in price.
Could This Actually Be A Bull Signal?
While Bitcoin’s brief dip below its 50-day moving average may be certified bearish news for some traders, others are looking for different interpretations of this indicator.
Looking at the trends from BTC Archive, we can see that merely dipping below the 50-day moving average, may not be completely conclusive evidence that a crash is inbound. In fact, when Bitcoin continues to close above the 50-day moving average (which it currently is), short-term bull runs are often expected.
Ultimately, there’s still a very strong chance that this current Bitcoin rally is what traders call a ‘bull trap‘ or a ‘dead cat bounce‘. This is where a short-term gain in price creates a false signal that leads less experienced investors to ‘FOMO-buy’. Unfortunately, these investors get caught holding the bag, and have to watch their portfolio continue to slide further into the red…
It goes without saying, but unless you have a solid understanding of reading financial charts and a very healthy appetite (& bank account) for risk, it’s probably a good idea to not bet the house on a technical indicator that can be read both ways…
DISCLAIMER:
This article is not intended as definitive legal, financial or investment advice and should not be construed or relied on as such. Before making any commitment of a legal or financial nature you should seek advice from a qualified and registered legal practitioner or financial or investment adviser.
Read Next